Digital Strategy: Six Awesome Things You Can Learn from Netflix
Having a digital strategy is critical for any business to succeed online.
Even just a few lines outlining what channels will be utilised and what you hope to achieve.
This way you can see if your online marketing strategy has been successful or not (which is fine) and learn from it going forward.
Every business tracks performance one way or another, simply counting how many customers visited this week compared to last, is a form of tracking.
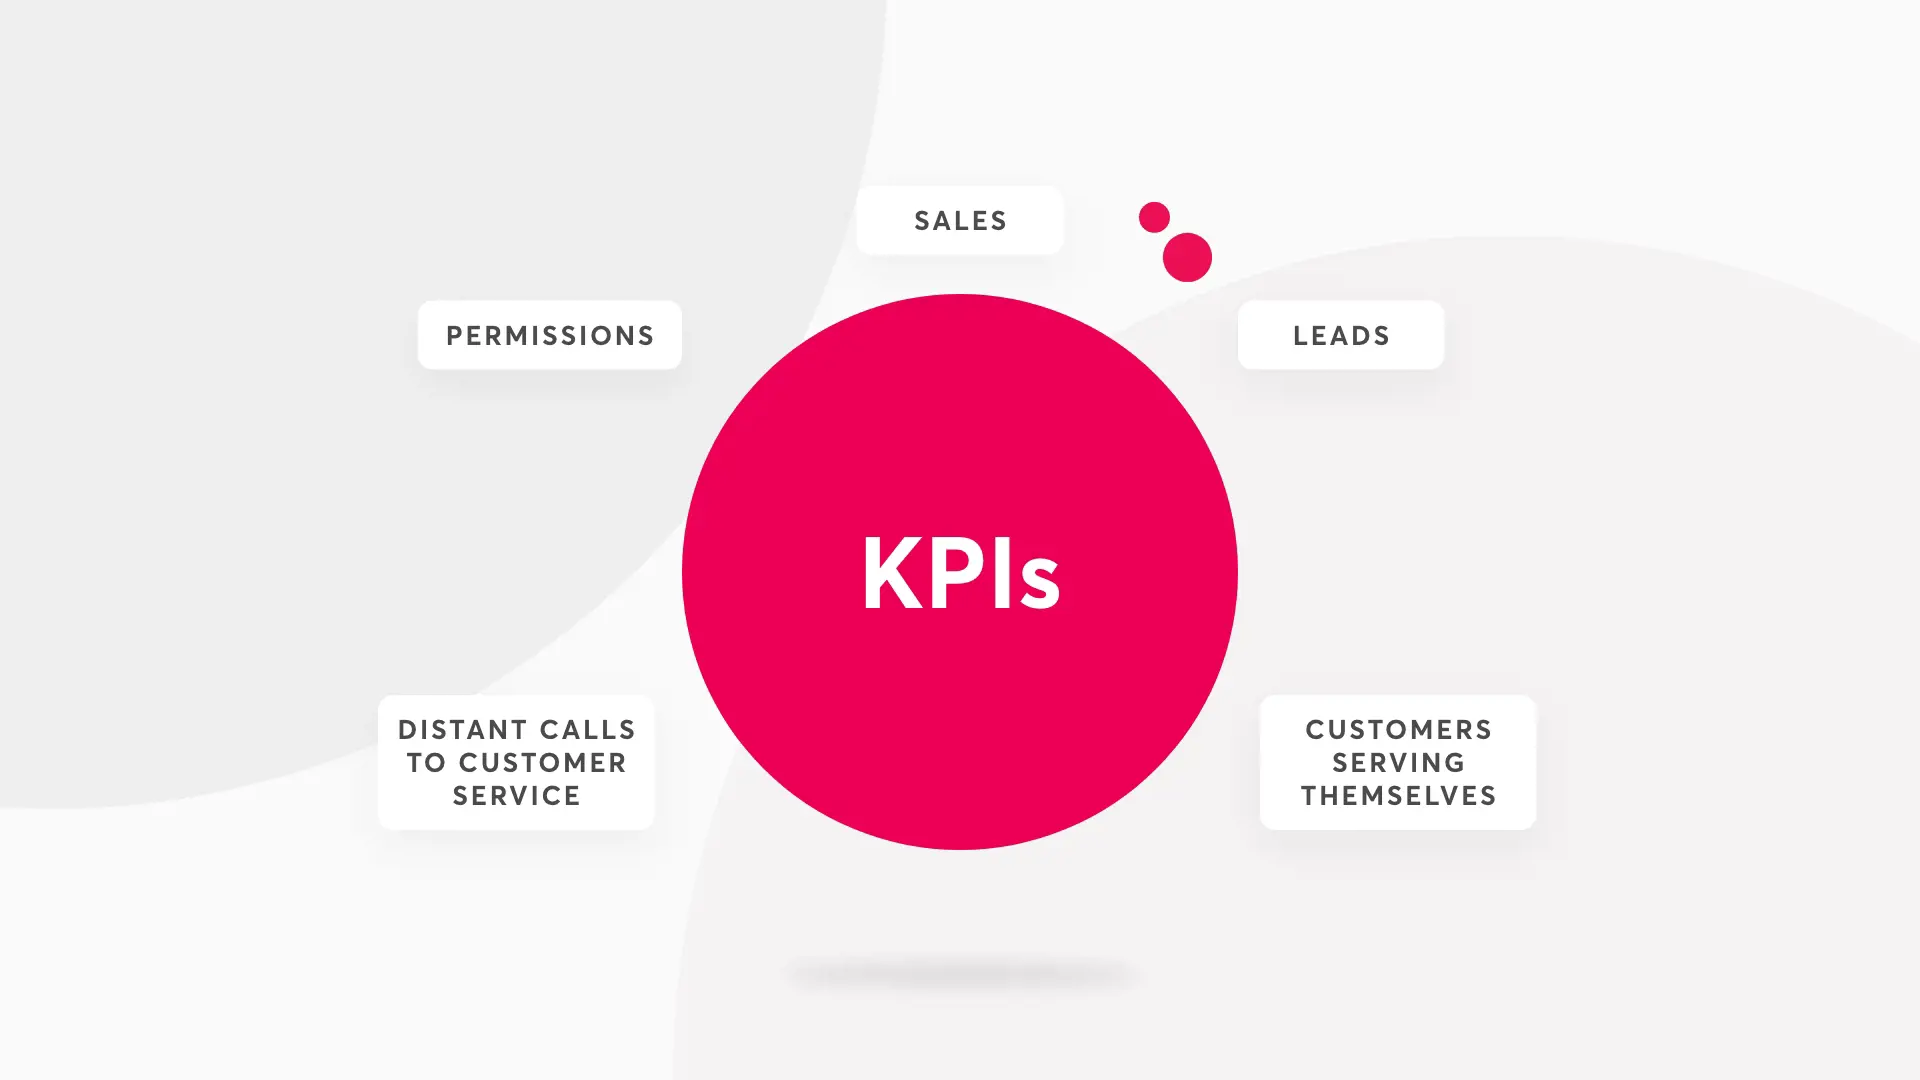
To build a digital strategy, best practice involves drilling down into the Key Performance Indicators (KPIs) and opting for a data-driven approach.

What is a digital marketing strategy?
Novicell is a digital strategy agency, we view internet marketing strategies as an overall plan to achieving a long-term goal which is agreed with the client.
This goal might be achieving 30% growth over a 12 month period.
We break down digital strategy into "Digital business strategy" and "Digital channel strategy."
The first focuses on achieving your company's potential, the second ensures customer contact points generate the highest possible business value.
The value of measuring data
To be data-driven in your digital marketing plan means that you have adopted the process of using accurate forecasting.
Rather than going with your gut instinct on strategic decisions.
In time, this is a sure-fire method of increasing performance and overall profitability.
A great example of a data-driven company is Netflix.
With 117 monthly users, Netflix tracks everything on their platform.
From how many hours each user watches to how many times they press the pause button.
How much Netflix do you watch?

Netflix tracks a vast array of KPIs and PIs to arrive at a critical conclusion; if a user watches at least 15 hours of Netflix in a month, they are 75% less likely to end their subscription.
On the other hand, if a user watches less than 5 hours a month, they are 95% more likely to cancel their subscription.
This is a precious insight which has helped to build a coherent digital marketing strategy.
So how does Netflix get the golden >15 hours?
Now Netflix has the data, they need to act on it otherwise it's worthless information.
If you’re not using the collected data in your digital strategy, then there is no point in spending the time and resources to collect and analyse it.
Insights need to facilitate digital actions which create results, action points in Netflix’s digital strategy include:
• Creating and adding new shows based off of most viewed genres
• Auto-playing the next episode
• Providing tailored recommendations in and out of the platform
• Auto-playing trailers and previews
• 5+ different trailers, showing the most relevant one based on previous behaviour
The most important aspect to take away from this is that you can break down their process into three easy steps:
• Set goals and KPIs
• Track significant parameters
• Use actionable data for future decisions

Creating a digital strategy
Planning your KPIs
Why plan? Failing to plan is planning to fail as cliché as that might sound.
If you plan what you want to achieve, you are more likely to reach it.
Having a goal in mind is more motivating; working towards a common goal is an investment towards spending time more efficiently in the long term.
Bulletproof KPI-setups answer three questions:
1. Is the online channel reach its overall goals?
2. Why/why not?
3. What are we going to do about it?
What’s stopping you from tracking KPIs?
The most common obstacles we see with new clients is that they haven’t got Analytics set up.
This means that you are missing out on vital data on your website which can have huge impacts on performance.
However, many issues people face is their CMS makes it difficult to implement any form of tracking through being outdated too tricky without support.
Think of it this way, not tracking any KPIs or viewing analytics is like having a physical shop and running it blindfolded.
You can’t see who’s visiting your store; their gender, age, what they’re most interested in or why they aren’t taking actions like purchasing a product.
So when it comes to creating adverts or improving your website, you are throwing time and money into the unknown and hoping for the best.
Google Analytics "audience" report
Here's an example of demographic data which can be easily viewed in Google Analytics for your site under "Audience."

What this data tells us is that the majority of the site users are females aged 25-34, now we can effectively target our advertising campaigns towards this particular demographic.
Whilst that is a great start to taking a more data-driven approach, there is still more to be done.
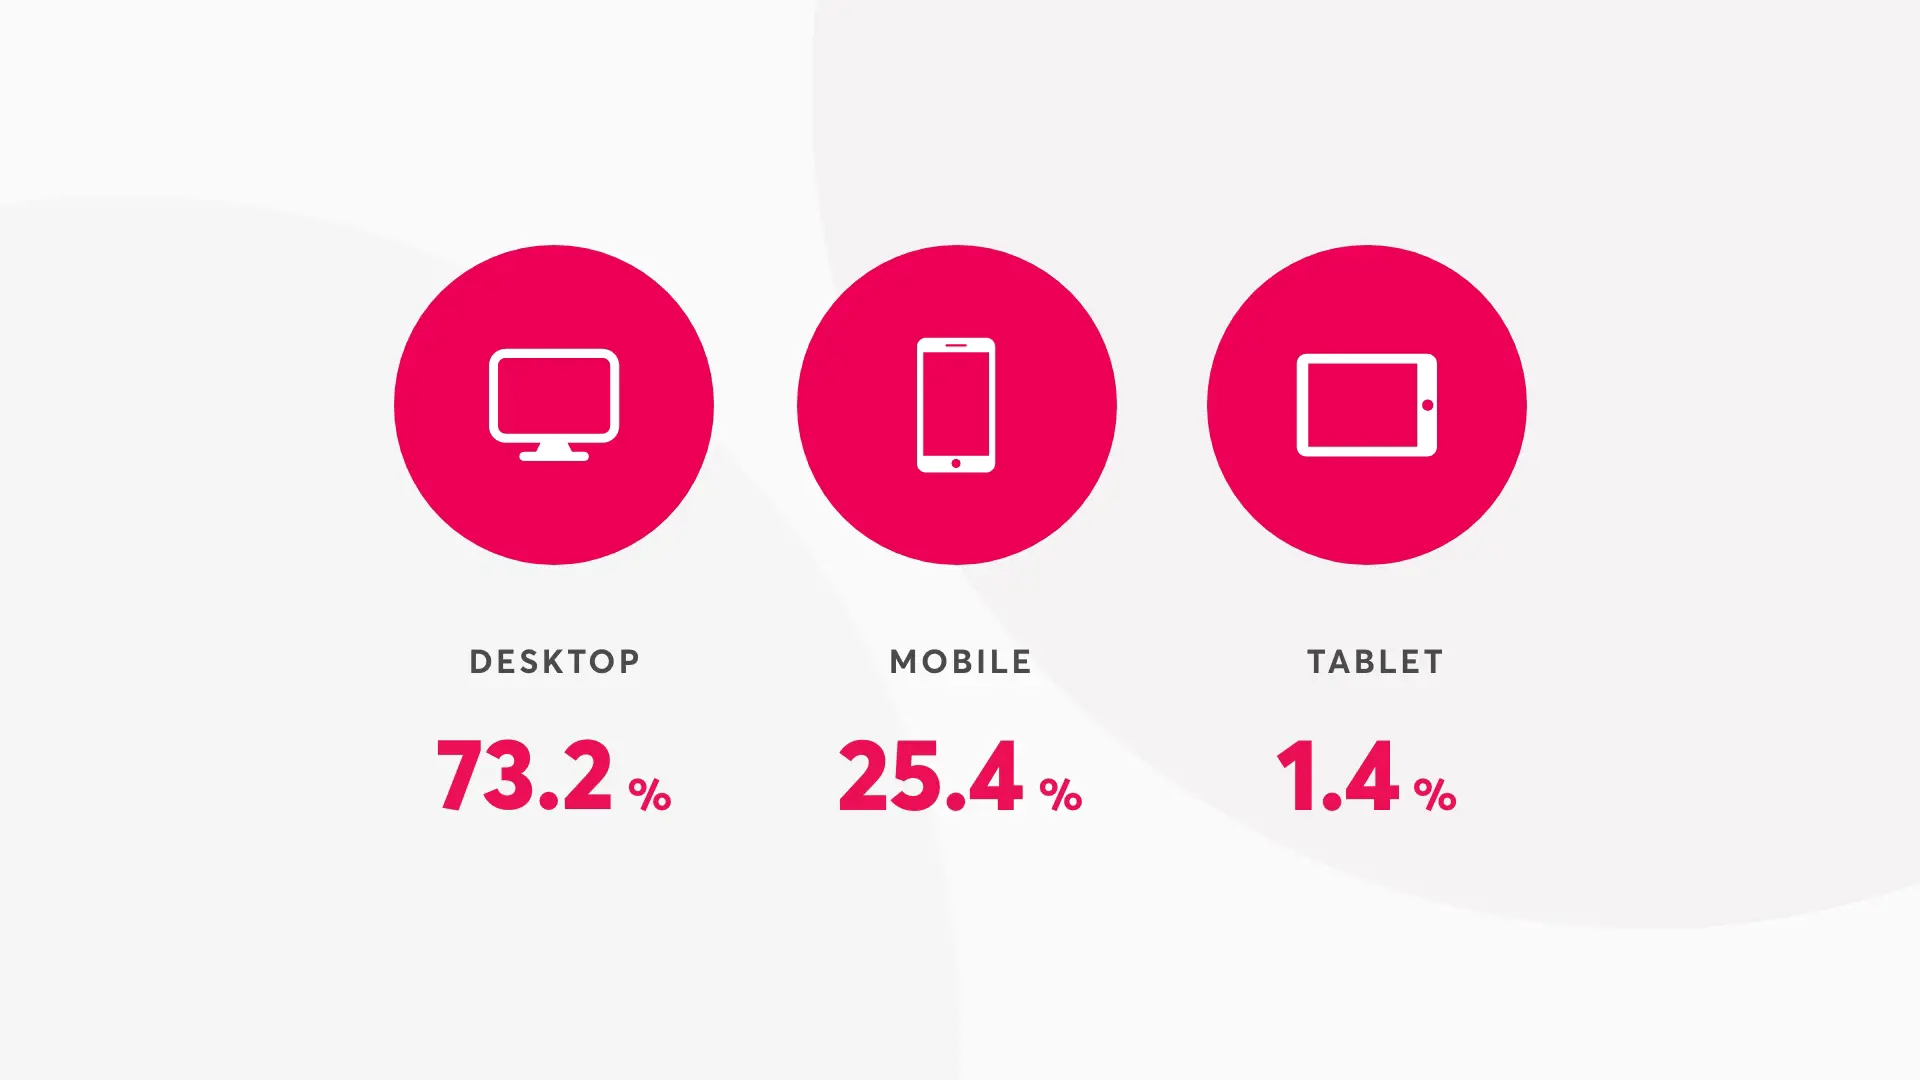
You can look at which demographic is actually completing conversions, on which device (mobile, desktop, or tablet) and at what time of day.


Looking at this data will tell you where to direct your ad spend
An example might be that the top converting demographic is females aged 25-34, who are viewing on a mobile, between the hours of 20:00-22:00.
Now you have just cut out a massive chunk of unnecessary ad spend and just left the top converting segment, this is a great tactic if you are working with a limited budget.
Before launching a project or start increasing advertising spend, ask yourself these questions:
• What is the company’s primary goal? (E.g. sales)
• What online channel are you using and how does it support the business goal? (E.g. Facebook and Facebook Business manager)
• What are the KPIs of the channel? (Conversions, clicks & engagement)
• What user actions push them closer to conversions? (Clicking an ad, watching a video or visiting a landing page)
With your company’s primary goals in mind, we can work backwards to understand the main focus areas and PIs that need to be tracked.